Factors of medicine accessibility
Source: GoodRx
Simply put, when cost becomes a barrier, care stops. It is a key predictor of whether a patient will start treatment and whether they will stay on it. Sudden insurance changes, high out-of-pocket costs, and unclear or shifting coverage rules can make the difference between a therapy being within reach or effectively impossible to start or maintain. Even small increases in cost burden can reduce patient adherence in taking the medicine, widen inequities between people who can afford medicines and those who cannot, and push manageable chronic conditions into crisis. When affordability breaks down, medicines healthcare prescribers determine will help a patient will be abandoned due to cost.
For too many Americans, affordability concerns often force them to make impossible tradeoffs between basic necessities like food and shelter and essential medicines for themselves or their families. This is exacerbated by a complex healthcare system that often lacks transparency around how medicines are priced and what patients are ultimately expected to pay.
Number of prescriptions left unfilled at the pharmacy each month in the US, because of cost:
46,000,000Source: GoodRx
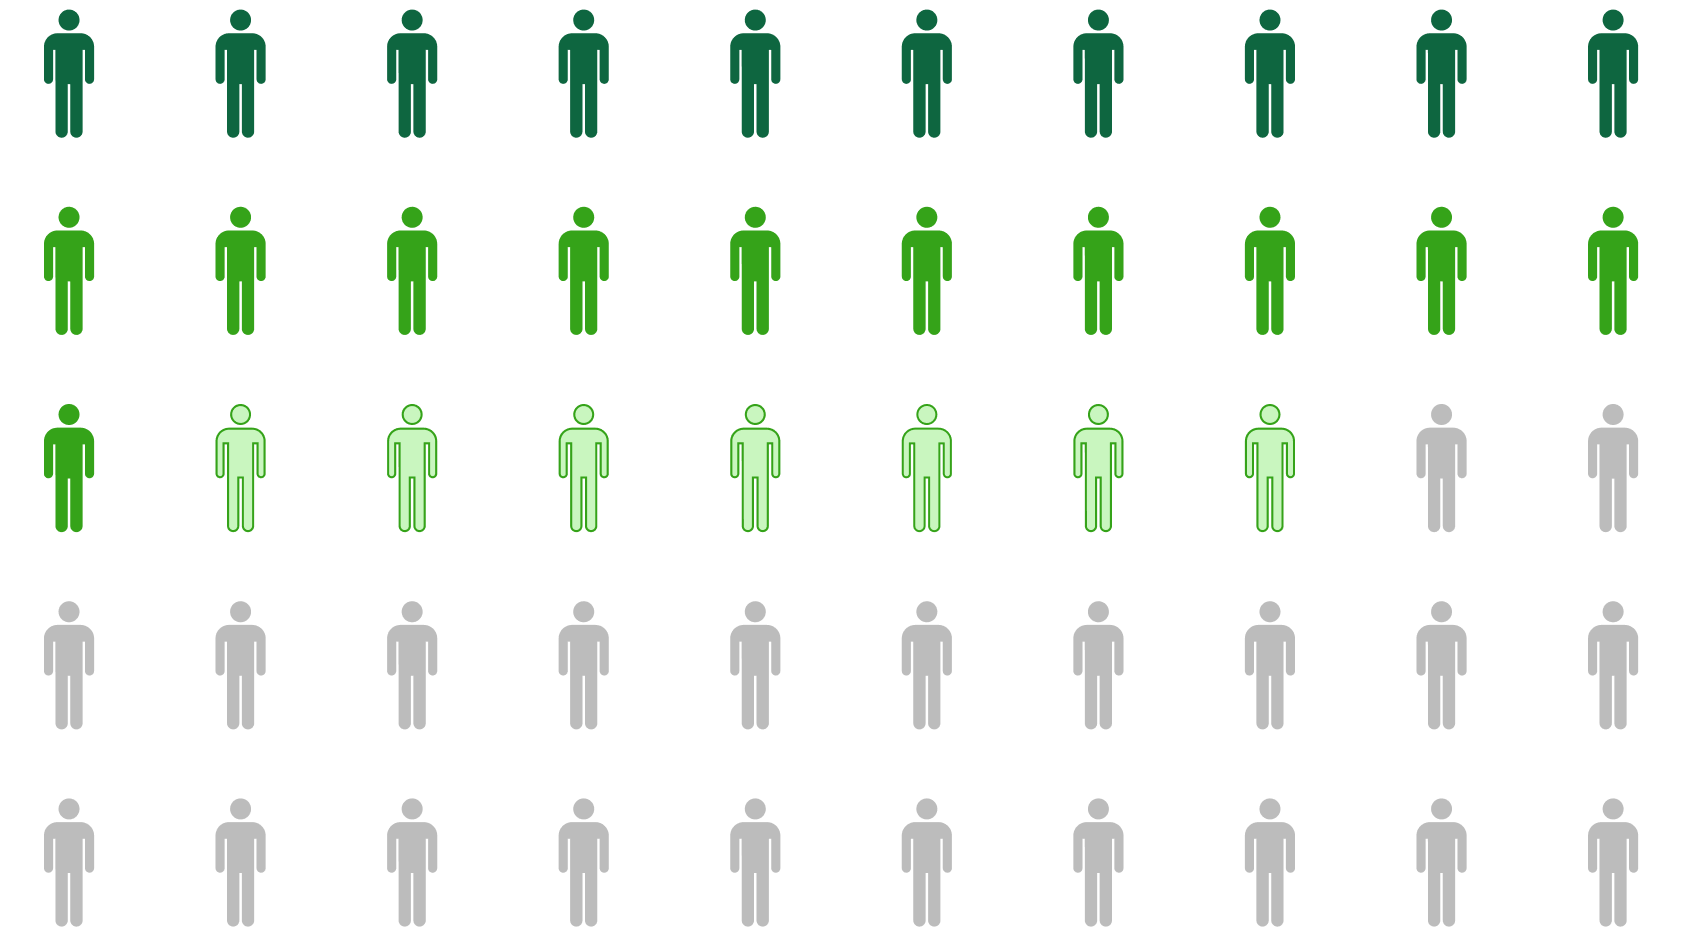
More than half of adults in America say they have not filled or taken full prescription dosage because of the cost
Source: Kaisr Family Fundation
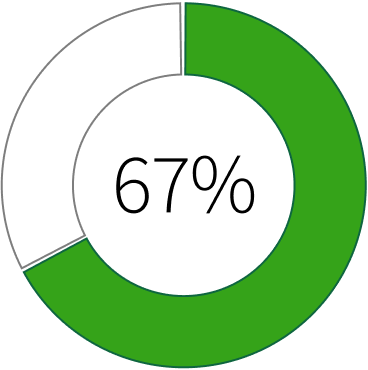
Proportion of Americans who filled a prescription in 2025 who said it created at least a minor financial burden
Source: Kaisr Family Fundation
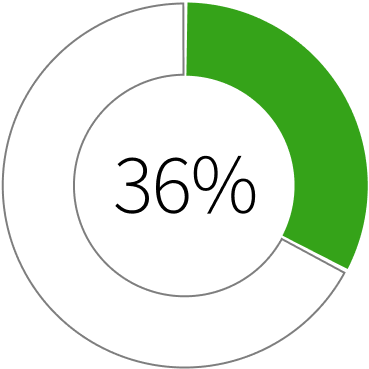
Proportion of adults who say they skipped or postponed getting health care they needed because of the cost in the past year
Source: GoodRx
There has been much debate and scrutiny around prices that drug manufacturers set, and that is an important consideration. But there are also several other forces that can have a huge impact on determining a patient’s actual cost, including insurance coverage, and regulations. Transparency around these elements reveals where barriers emerge, where support is needed, and where targeted interventions can reduce financial strain and help keep treatments within reach.
The price set by manufacturers based on research & development, raw materials, labor costs, manufacturing complexity, regulatory requirements, logistics, overhead, and competitive market dynamics
The fees, rebates, and incentives introduced by organizations that negotiate, manage, distribute, and dispense medications—such as PBMs, wholesalers, and specialty pharmacies—shaping the gap between list price, net price, and patient out-of-pocket cost
How insurers and government programs (including Medicare and Medicaid) determine drug coverage, formulary placement, utilization controls, and patient cost-sharing requirements
Manufacturer-, nonprofit-, or government-run assistance that reduces patient costs through copay support, free or discounted medication, grants, or care and access navigation
The federal and state rules that govern drug pricing and access, including Medicare negotiation and inflation penalties, Medicaid rebates, and coverage and reimbursement requirements
The cost of any medication is shaped by multiple components across the healthcare ecosystem—not just the medicine itself. The following breakdown highlights how investments in research and development, manufacturing, supply chain, insurance dynamics, and administrative and system-level costs all contribute to the final price patients encounter at the pharmacy.
R&D costs are minimal because generics don't need to prove a drug works; that's already been done by the original brand. They only need to show their version behaves the same way in the body.
Made up mostly of bioequivalence studies (small trials that compare absorption rates), regulatory filing fees, and IP litigation costs if a brand patent needs to be challenged. Total development runs $1.5–4M per drug.
¹ PhRMA / Pharmaceutical Technology — generic development cost benchmarks
Manufacturing is the biggest cost for generic makers because it's essentially their entire product — they're not spending on discovery, just production. Thin margins mean efficiency here is critical.
Primarily the active pharmaceutical ingredient (API — the chemical that does the work), excipients (fillers, binders), tablet pressing or capsule filling, packaging, and quality testing. Most APIs are sourced from manufacturers in India and China.
³ BCG — Getting a Grip on COGS in Generic Drugs, 2019
Generic drugs are cheap, which means each step in the supply chain takes a much bigger percentage cut than it would for a high-priced brand drug. Intermediaries end up keeping more of the pie than the manufacturer does.
Covers wholesalers (who buy from manufacturers and sell to pharmacies), pharmacy dispensing costs, and freight. Wholesalers, pharmacies, and PBMs collectively capture roughly 64% of the final retail revenue on generics — vs. only ~24% for brand drugs.
⁵ DrugPatentWatch / USC Schaeffer / HHS ASPE — generic supply chain value capture
⁶ NCBI / MedPAC — Profit Margins of Pharmaceutical Supply Chain Entities, 2020–2022
Generics carry lower rebates because insurers don't need to negotiate hard — generic prices are already low, and competition between multiple manufacturers keeps them that way.
Includes Medicaid rebates (13% of average manufacturer price, set by law), PBM administrative fees, and pharmacy claims processing costs. There's minimal negotiation overhead since pharmacies often substitute generics automatically.
⁹ Commonwealth Fund — What PBMs Do, 2025
¹⁰ KFF — 5 Key Facts About Medicaid Prescription Drugs
Generic companies spend very little on marketing (doctors don't need to be persuaded to prescribe a generic) but face intense price competition, so profit margins per unit are thin and depend heavily on volume.
SG&A includes sales force costs, general administration, and legal expenses (especially patent challenges). Teva, the largest generic manufacturer, runs sales & marketing at ~12–16% of revenue and G&A at ~11%. Profit margins of 30–50% on cost of goods are achievable at scale, but net margins are modest.
¹¹ Teva SEC filings 8-K, 2023–2024
Biosimilars are copies of biologic drugs made from living cells, which are far harder to replicate exactly. Regulators require clinical trials to confirm the copy is safe and effective, driving up costs significantly.
Costs include Phase I and Phase III clinical trials, extensive analytical testing to confirm the molecule matches the original, and regulatory submissions. Average development cost is ~$375M per biosimilar.
¹ PhRMA / Pharmaceutical Technology — generic development cost benchmarks
Biosimilars are grown in living cells (bacteria, yeast, or mammalian cells), which makes manufacturing far more complex and expensive than mixing chemicals. Even small process changes can affect the final product.
Costs include bioreactor cell culture, purification, fill-and-finish (sterile packaging), cold-chain storage, and extensive quality release testing. At commercial scale, modern manufacturing tech can reduce unit costs by up to 70%.
¹ PhRMA / Pharmaceutical Technology — generic development cost benchmarks
⁴ BCG — Strategic Approach to Cost in Biopharma, 2023
Biosimilars are injectable or infused drugs that go through specialty pharmacies and hospital systems — fewer middlemen than retail generics, but more complex handling requirements.
Includes cold-chain transportation and storage (most biologics must be refrigerated), specialty pharmacy dispensing, and hub services (the patient support programs that help with insurance navigation and delivery). Wholesaler margins on biologics run ~1.8–3.3% of net spending.
⁶ NCBI / MedPAC — Profit Margins of Pharmaceutical Supply Chain Entities, 2020–2022
Biosimilars face a paradox: they're cheaper than the brand drugs they copy, but that lower price actually makes it harder to get onto insurance formularies. PBMs earn rebates as a percentage of list price, so they often prefer the more expensive branded drug because it generates a bigger rebate for them.
Biosimilar/originator drug pairs had the highest average rebates of any drug category in 2023 — a median of 71% off list price — largely because of this competitive dynamic. Manufacturer rebates, PBM fees, and prior authorization administrative costs all fall in this bucket.
⁷ PMC / SSR Health — specialty rebate analysis, n=161 drugs, Dec 2023
⁸ DrugPatentWatch — gross-to-net bubble, 2024
Biosimilar companies spend more on sales than generic makers (they need to convince doctors and hospitals to switch from the brand), but less than specialty innovators who are launching entirely new drugs.
Includes medical affairs teams (educating clinicians on interchangeability), market access teams (negotiating payer coverage), and general overhead. Because biosimilars are priced lower than the originator, profit margins are tighter and depend on winning significant market share.
² Drug Discovery Trends — biosimilar company financials, 2023
¹¹ Teva SEC filings 8-K, 2023–2024
Specialty drugs treat complex, often rare conditions and must be discovered from scratch: a long, expensive process with a high failure rate. Only about 1 in 10 drugs that enter clinical trials ever makes it to market.
Covers all phases of clinical trials (Phase I–III), pre-clinical research, and regulatory approval. Average cost per approved specialty drug exceeds $1.2B. Large pharma companies typically spend 14–30% of their total revenue on R&D across their portfolio.
¹ PhRMA / Pharmaceutical Technology — generic development cost benchmarks
Specialty drugs are expensive to make in absolute terms, but because their prices are so high, manufacturing represents a smaller slice of the total cost pie than you'd expect.
Includes biological production (for biologics), sterile drug formulation, specialized packaging, and rigorous QA testing. For cell and gene therapies, manufacturing can cost tens of thousands of dollars per patient dose alone. Unit economics improve dramatically with volume — costs fall ~30% each time production volume doubles.
⁴ BCG — Strategic Approach to Cost in Biopharma, 2023
Because specialty drugs are so expensive, the supply chain cost is a small percentage even though the absolute dollar cost per shipment is high. The high price dilutes the relative weight of logistics.
Specialty drugs typically flow through dedicated specialty pharmacies (not regular retail pharmacies), and often require temperature-controlled shipping, limited distribution networks, and mandatory patient monitoring programs. These add real cost, but remain a small fraction of the drug's total price.
⁶ NCBI / MedPAC — Profit Margins of Pharmaceutical Supply Chain Entities, 2020–2022
Specialty drugs are where the rebate system is most extreme. Manufacturers set very high list prices, then pay large secret rebates to PBMs and insurers to secure formulary placement — meaning the sticker price almost never reflects what anyone actually pays.
The gap between what's listed and what's actually paid ("gross-to-net") reached an estimated $356B across all brand drugs in 2024. The median specialty drug rebate was 27% off list price in 2023, but varied widely (16–53%). PBMs pass roughly 91% of negotiated rebates back to health insurers. Brand drug Medicaid rebates start at ≥23.1% of average manufacturer price by law.
⁷ PMC / SSR Health — specialty rebate analysis, n=161 drugs, Dec 2023
⁸ DrugPatentWatch — gross-to-net bubble, 2024
⁹ Commonwealth Fund — What PBMs Do, 2025
¹⁰ KFF — 5 Key Facts About Medicaid Prescription Drugs
Specialty drug companies spend heavily on sales and marketing to build awareness among the specialists who prescribe these drugs, and on patient support programs. Despite high gross margins, large rebates compress how much revenue they actually keep.
Includes specialist sales forces, direct-to-consumer advertising (where allowed), patient assistance programs, and corporate overhead. AbbVie and Sanofi — two of the largest specialty drug makers — have combined R&D and SG&A that together consume 30–50% of revenue. Operating margins of 25–40% on net revenue are common for top-selling specialty drugs.
² Drug Discovery Trends — AbbVie, Sanofi, Novo Nordisk financials, 2023
⁸ DrugPatentWatch — specialty drug economics, 2024
Chintu Patel was a pharmacist who started Amneal with his brother Chirag because he had seen too many customers struggling to choose between paying for essential medicines and food, and they set out to help make high-quality medicines more affordable.
Today, Amneal continues its commitment to improving affordability by developing more and more complex generics, biosimilars, injectables, and specialty medicines covering a broad range of indications. To further lower barriers to access, Amneal offers a range of Patient Support Programs, including our Patient Assistance Program which helps eligible individuals receive free medication for up to one year. Through these efforts, we work to ensure that clinically appropriate treatments remain within reach for the people who rely on them.
The information presented in this Accessibility Index is compiled from publicly available sources believed to be reliable at the time of publication. However, Amneal makes no representations or warranties, express or implied, regarding the accuracy, completeness, or timeliness of the data provided. The content is for informational purposes only and does not constitute professional advice or endorsement.
The views and opinions expressed in this index do not necessarily reflect those of Amneal, its affiliates, or its employees. Amneal disclaims any liability for any decisions made or actions taken based on the information contained herein.
This index is intended to support awareness and understanding of medicine accessibility and is not a substitute for professional consultation or regulatory guidance. Users are encouraged to verify information independently and consult appropriate experts before making decisions.
By using this site, you acknowledge and agree to these terms.